DATA PIPELINE & ANALYTICS SERVICES
Data You Can Trust — With Apps You Already Know
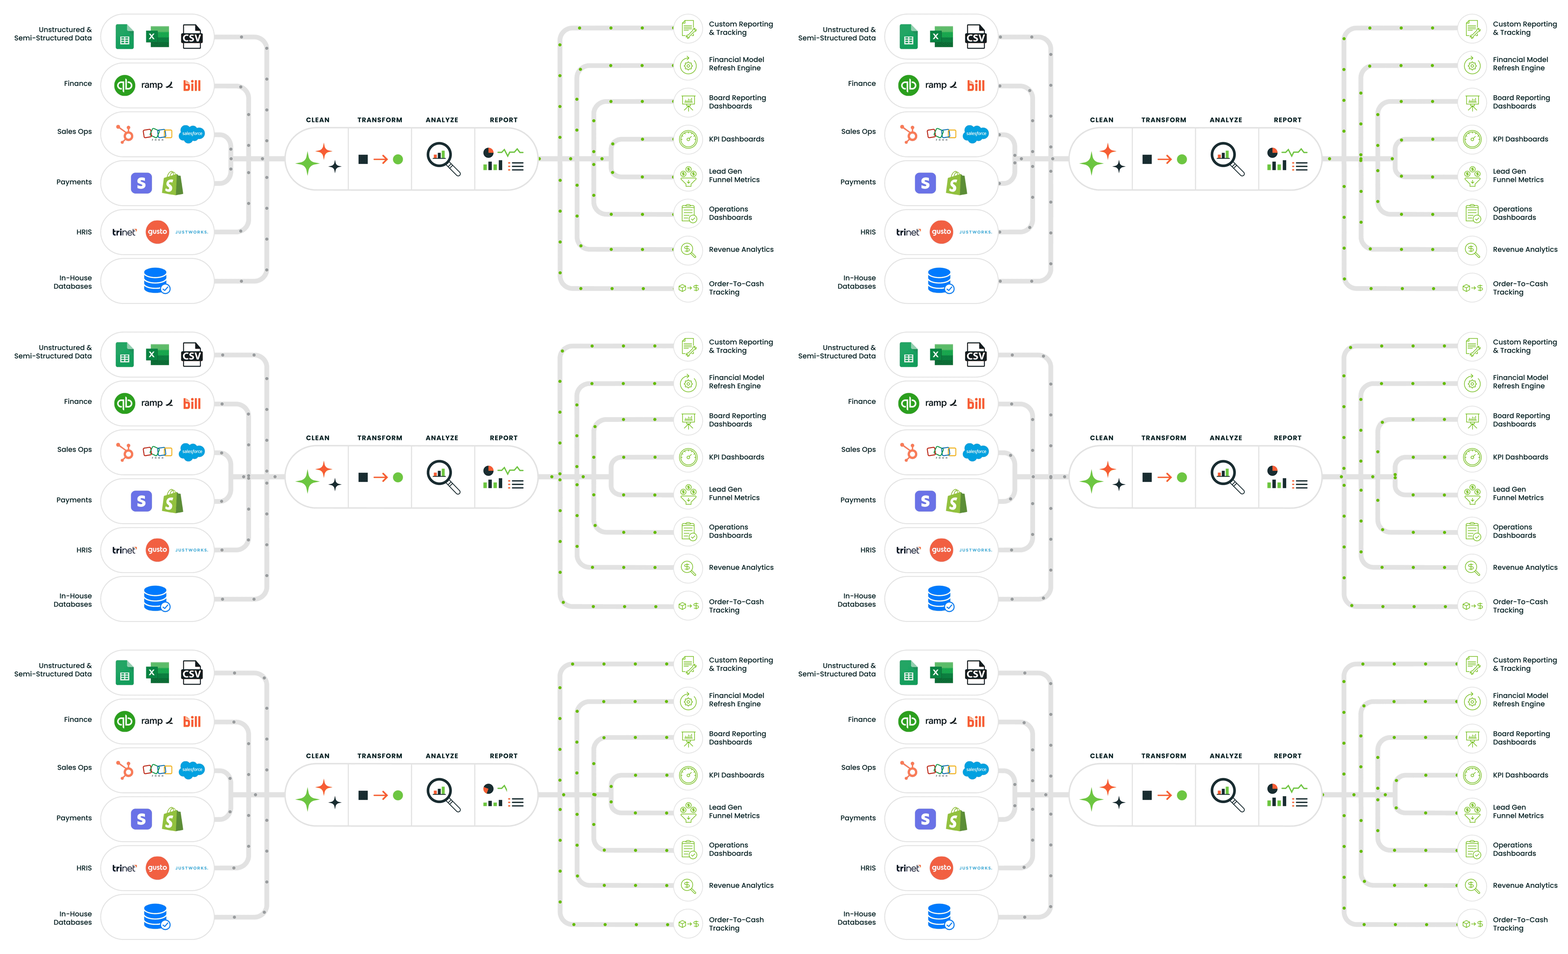
We clean and integrate your data across operational silos and apps and make it accessible, actionable, and scalable. Flexibly and affordably.
We do the data work behind the scenes so your team can focus on what matters most: building product, finding PMF, and driving adoption.
We build affordable integrated data pipelines that feed into Google Sheets, bringing real-time insights from your data silos and apps into a centralized, easy-to-use format.
Whether you're scaling financial operations, reporting to your board, or diving into growth metrics, we give you clean, reliable data right where you need it.
Our robust and flexible data pipelines are tailored to the unique needs of early- and growth-stage tech startups. Our approach combines deep financial expertise with smart automation to ensure your team can access clean, timely, and actionable data.
To be clear, we do not overengineer the data pipelines. We keep them as simple as possible to deliver a strong ROI.
COMMON PITFALLS IN BUILDING DATA PIPELINES
We’ve seen it all—scrappy DIY setups, overbuilt enterprise tools, and everything in between.
We can help.
Implementing Off-The-Shelf Tools Too Early
Tools like Looker, Power BI, or Snowflake are powerful—but they’re also heavy. Startups often adopt them prematurely, only to find they’re expensive, overkill, and hard to maintain without a full data team. We help you start lean, fast, and right-sized with scalable Google Sheets dashboards that grow with your business.
Building Without A Clear Use Case
Many teams start pulling in data before knowing what they want to measure. We help clients define key questions, metrics, and users upfront—so every pipeline serves a clear business goal.
Skipping The Modeling Layer
Raw data ≠ answers. Without thoughtful data transformation and standardization, like mapping revenue types or normalizing deal stages, you get dashboards that mislead more than they help.
Over-Automating Too Soon
Automation is great—until it breaks. Teams often invest in end-to-end automation before their data is stable or well-defined. At Matcha, we build with enough structure to scale and enough flexibility to adapt as your business evolves.
Making Pipelines Black Boxes
If only a couple of engineers know how your data flows, you're a couple of resignations away from a data crisis. We build transparent pipelines and models that anyone on your team can understand and manipulate—even if they never touch a line of code.
WHY GOOGLE SHEETS?
We use Google Sheets as the front end for your data because it offers unmatched clarity, speed, and flexibility without adding complexity to your workflow.
It’s also the most cost-effective approach.
By combining automation and smart design, we make Google Sheets your team’s single source of truth—intuitive, fast, scalable, and built for action.
No New Tools to Learn
Your team can instantly access up-to-date dashboards in a tool they already know. No training, no logins, no BI overhead.
Live Data, No Time-Consuming Manual Editing
We fully manage the logic and structure, so your team always sees accurate, reliable outputs—without needing to touch a thing.
Easy to Explore
While we handle all the heavy lifting, your team can filter, sort, and export key tables and views for ad-hoc analysis or board decks.
Connects to Everything for Unified Metrics
Google Sheets integrates seamlessly with tools like QBO, Stripe, HubSpot, Shopify, and in-house databases.
Clear, Familiar Interface
Whether you're a founder, operator, or investor, the data lives in a spreadsheet—not hidden in code or black-box dashboards.
Lightning-Fast Iteration
Need a new metric, view, or KPI? We can build and deploy updates in days, not weeks—far faster than traditional BI or dev cycles.
Collaboration-Ready Visibility
Your team can leave comments right in context, speeding up decision-making without breaking the models.
Affordability
Cost-effective and scalable solution ideal for startups seeking flexibility without the heavy infrastructure and maintenance costs.
THE PROCESS
Kickoff & Planning
Integration & Transformation
Dashboard Buildout
Ongoing Enhancements
We scope your tools, reporting needs, and data sources.
Our team cleans the data and automates the data flow into structured models.
We create sleek, stakeholder-ready views.
We maintain the data pipeline and continuously enhance as needed.
Get Real-Time Insights —Without Learning a New Tool
We make your existing stack smarter by bringing your data to life in Google Sheets. One click, one source of truth.
Let’s talk and build your data advantage, the smart way.


